Ingesting custom logs from Microsoft Sentinel Auxiliary tables using Logstash
Introduction
On July 25, 2024 Microsoft announced the public preview for auxiliary logs. To date (May 2025) no general availability launch has been announced, however it can be used by anyone as it is in public preview. Since then, Sentinel Professionals have been trying their hand at working implementations for Auxiliary Logs.
The Auxiliary logs key concept
Creating a tertiary log style (in addition to Basic logs and Analytic Logs) that is more cost effective in storage and processing. These larger, cheaper logs can then be stored long term - up to 12 years if desired - and be routed into Analytics logs using summary rules where they can then be used for advanced analysis and alerting.
These are considered verbose logs - verbose in this context meaning more detailed than usual. This can include any extra data of your choosing like internal state, metadata or other low-level events that are usually not stored – can be exceptionally useful in order to query the larger dataset for advanced forensics or other specialised uses (without incurring the storage, processing or bandwidth costs of basic logs or analytic logs).
The solutions for making the auxiliary logs usable are as of yet sparse. A prolonged deep dive on the topic makes light of many different solutions; such as the Cribl GUI which doesn’t quite take you all the way (even though their Interface is easy to use), all the way to trying your hand at setting up a Logstash connection via the command line in a Virtual Machine.
Logstash
Logstash is an open source - data processing pipeline by Elastic Stack that can be used to send our auxiliary logs data in a usable form, to a desired custom endpoint. The data format being the initial challenge. These verbose logs will consist of many different datatypes and be in different formats: they must be piped into a standardised table format, in order to be usable again when they arrive back in the Microsoft environment.
Multiple pipelines within Logstash allow us to define multiple inputs to each be allocated to their own table, into which the Microsoft agent will then push them in Sentinel.
It supports more than our current use case. This means we can get data inputs from various sources such as files, S3, beats kafka ect. and have the Logstash output be piped into a variety of services such as elastic search, AWS, Hadoop, MongoDB ect.
Logstash can:
• Parse, transform and filter data
• Derive a structure from unstructured data
• Anonymize and/or exclude personal data
• Do a geo-location lookup
• Scale across many nodes
• Guarantees at-least-once delivery of data
• Absorb throughput from load spikes
Auxiliary Log Tables
Currently this can only be created via the API. While they can be collected in a text/JSON file with Azure monitor agent, we went the Logs Ingestion API route for general reusability.
The Auxiliary log tables are standardised to contain two columns that are mandatory: RawData (type string) and TimeGenerated.
TimeGenerated - is usually automatically populated, while one should note this column only supports the ISO 8601 format with 6 decimal places for precision (nanoseconds).
The entire log entry will be sent into the RawData column by the Data collection rule (DCR).
Installing Logstash: how to install
• Prerequisites:
Data collection rule: Create a DCR using the given Azure Resource Manager (ARM) template below; go to the Azure Portal
The template used is as given by Microsoft Documentation: Azure Monitor – DCR
• Deploy a custom template > Custom Template
• Build your own template in editor > copy the ARM template from the link above
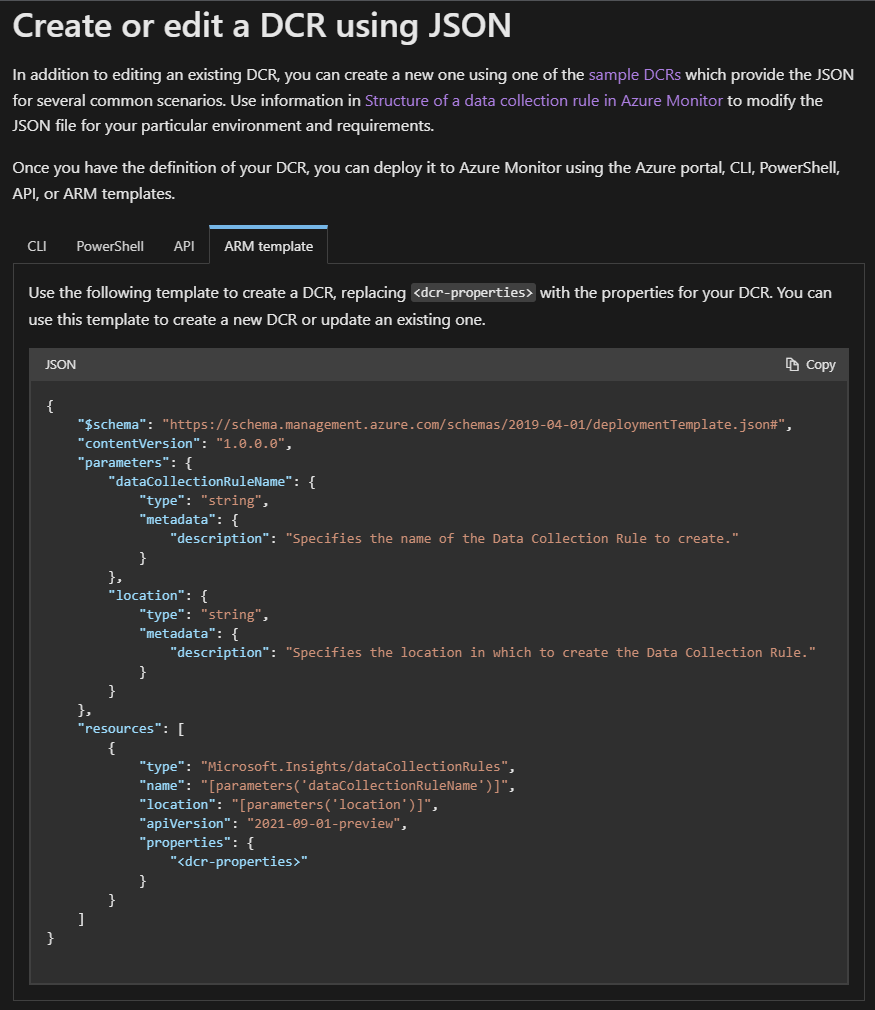
Template

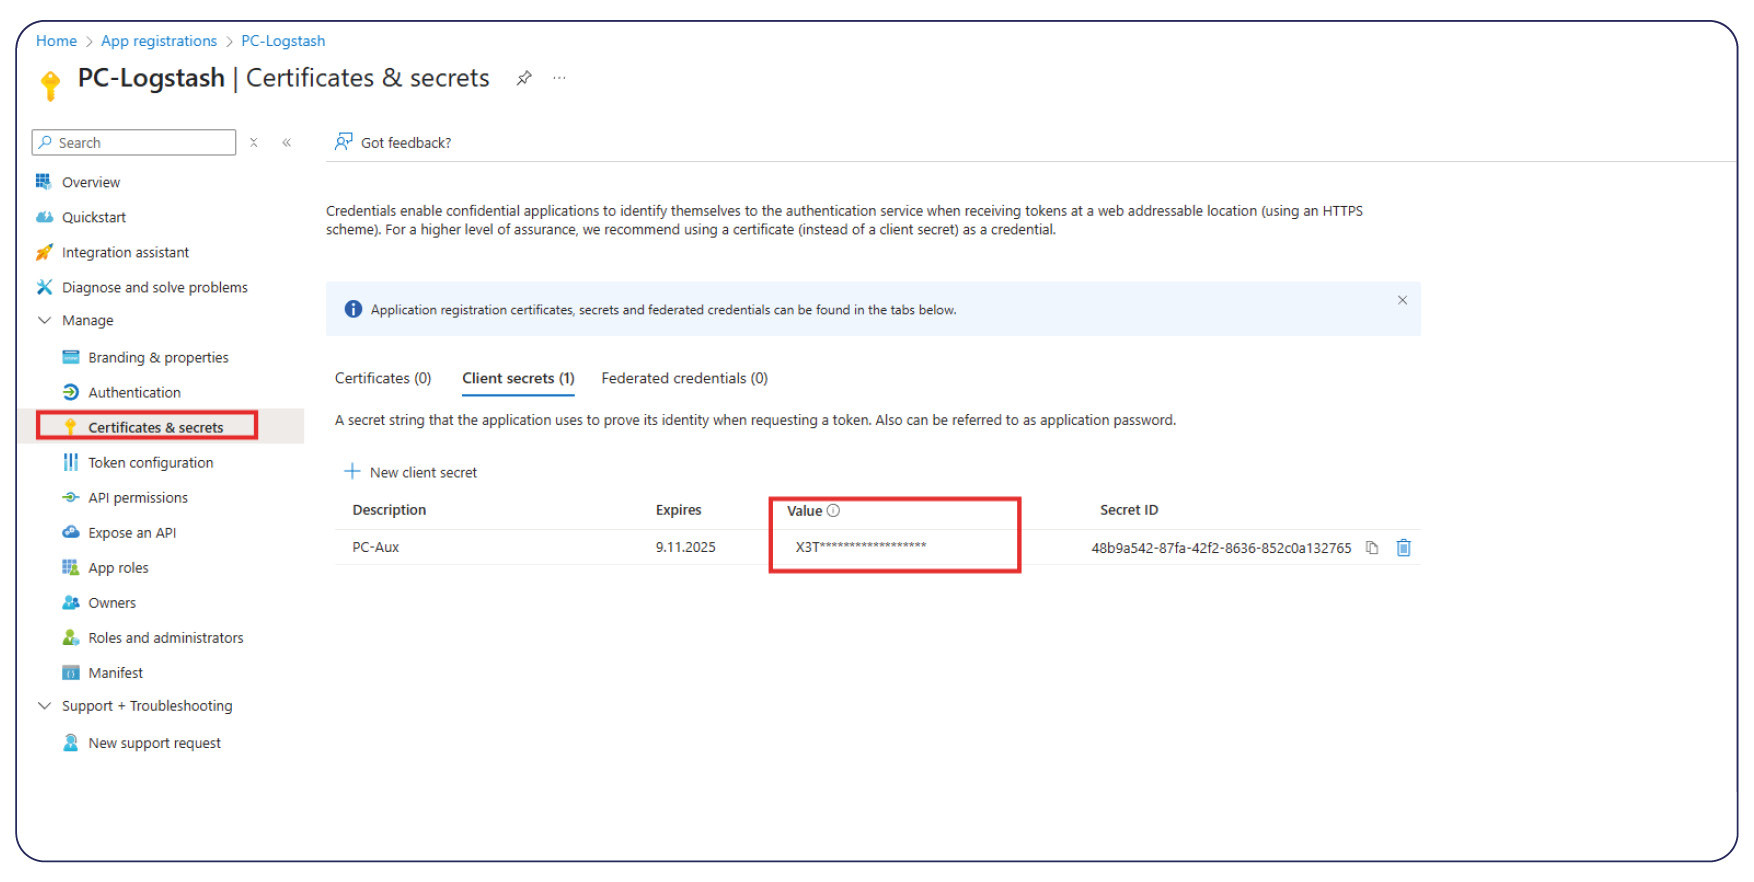
App Registration:
On the Azure Portal you will need to register an app under:
Entra ID > App Registration > New registration
and collect the following for later:
• Application ID (Client ID) copy and save
• Tenant ID copy and save

• Create a secret, then copy and save
Data collection endpoint
• Copy and save the logs ingestion URL on the right (Overview)
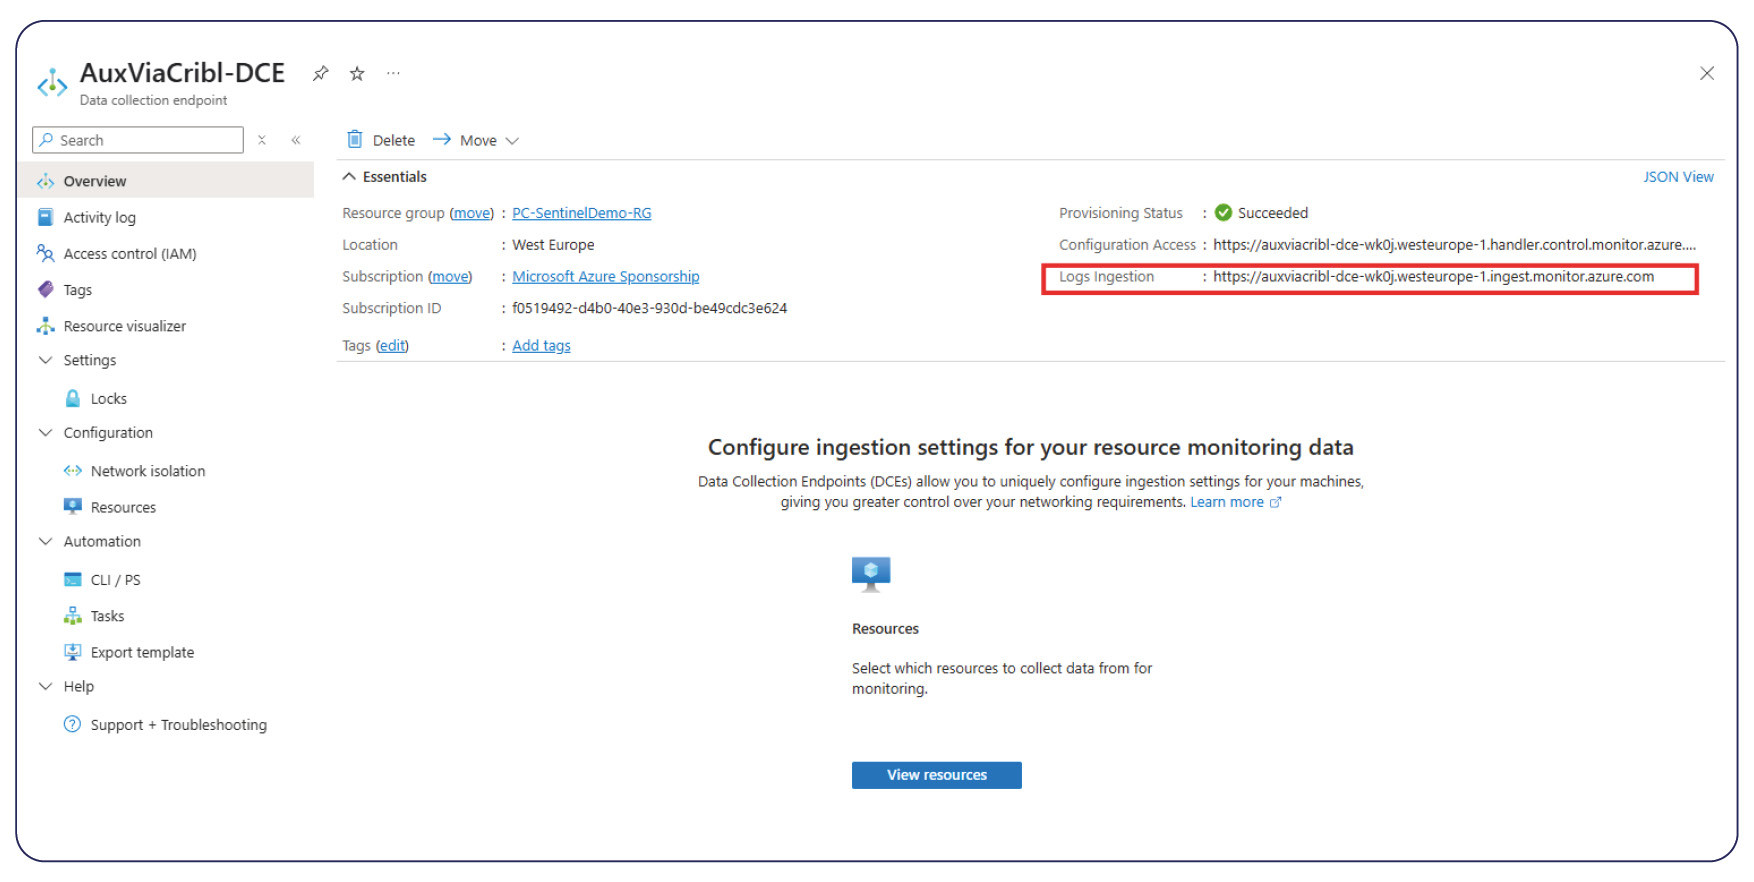
• Under our Data Collection Endpoint > go to JSON View
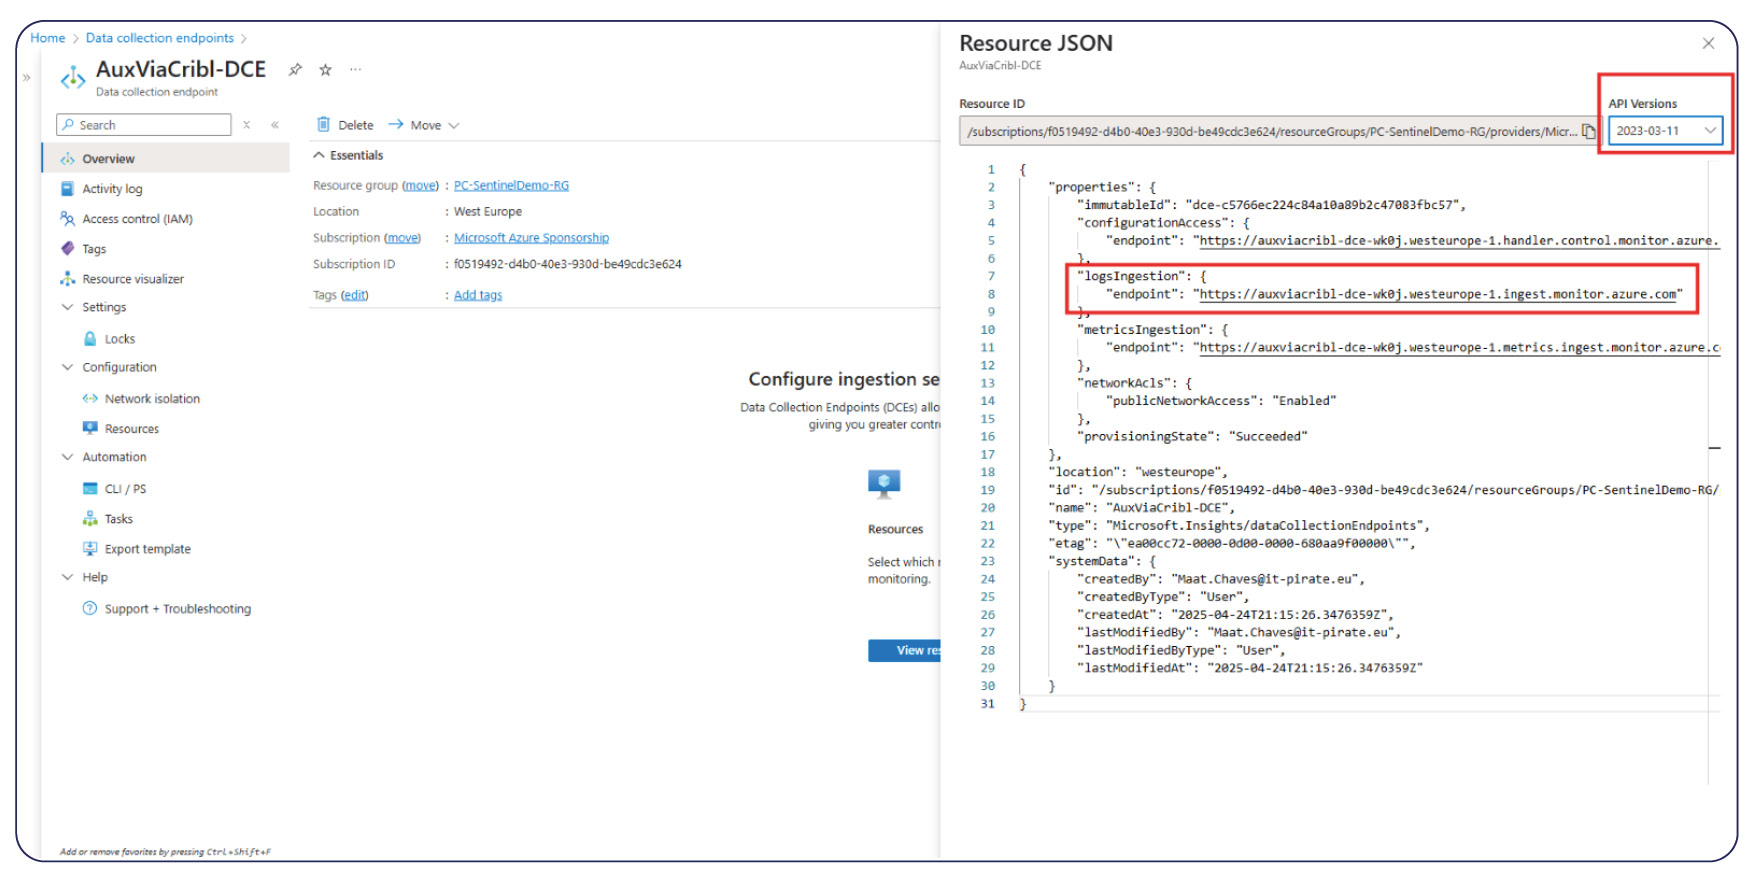
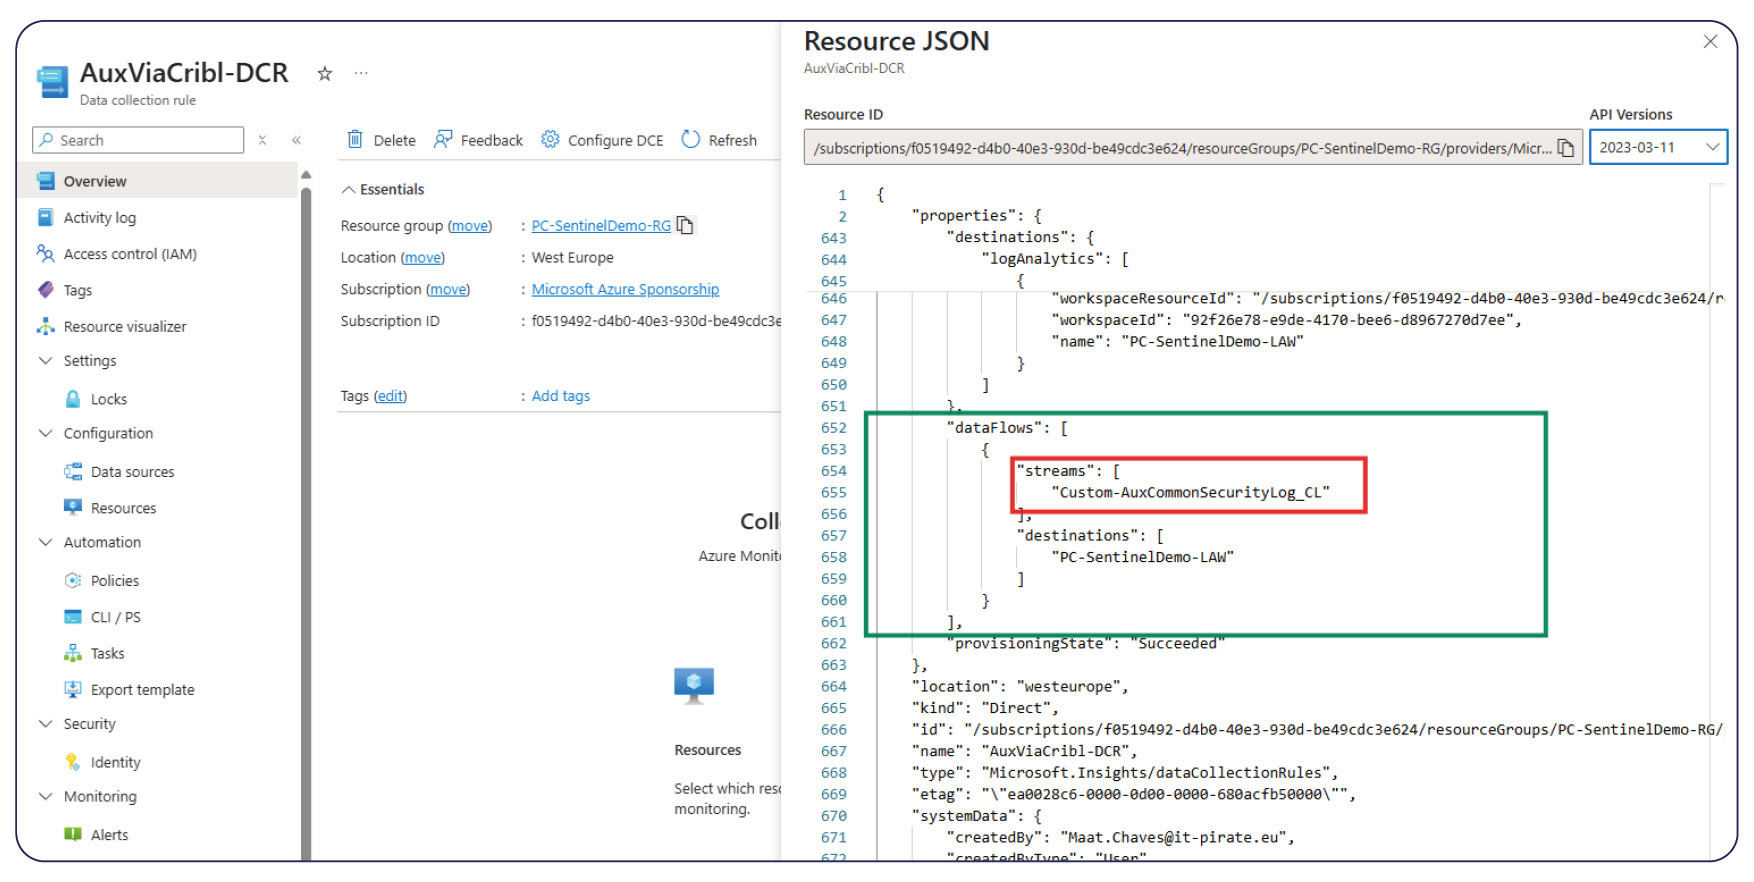
• Set the "dataflows" > "Streams" to the auxiliary table
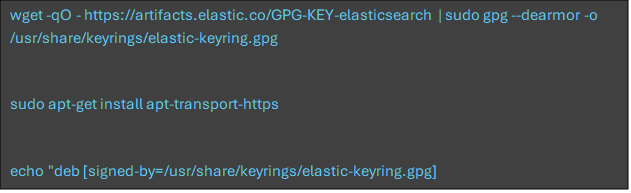
Install Longstash
Logstash is to be installed into the Syslogs, so that we may receive the piped tables in our Auxiliary logs in Microsoft Sentinel.
For further documentation, see: Installing Logstash | Elastic Documentation
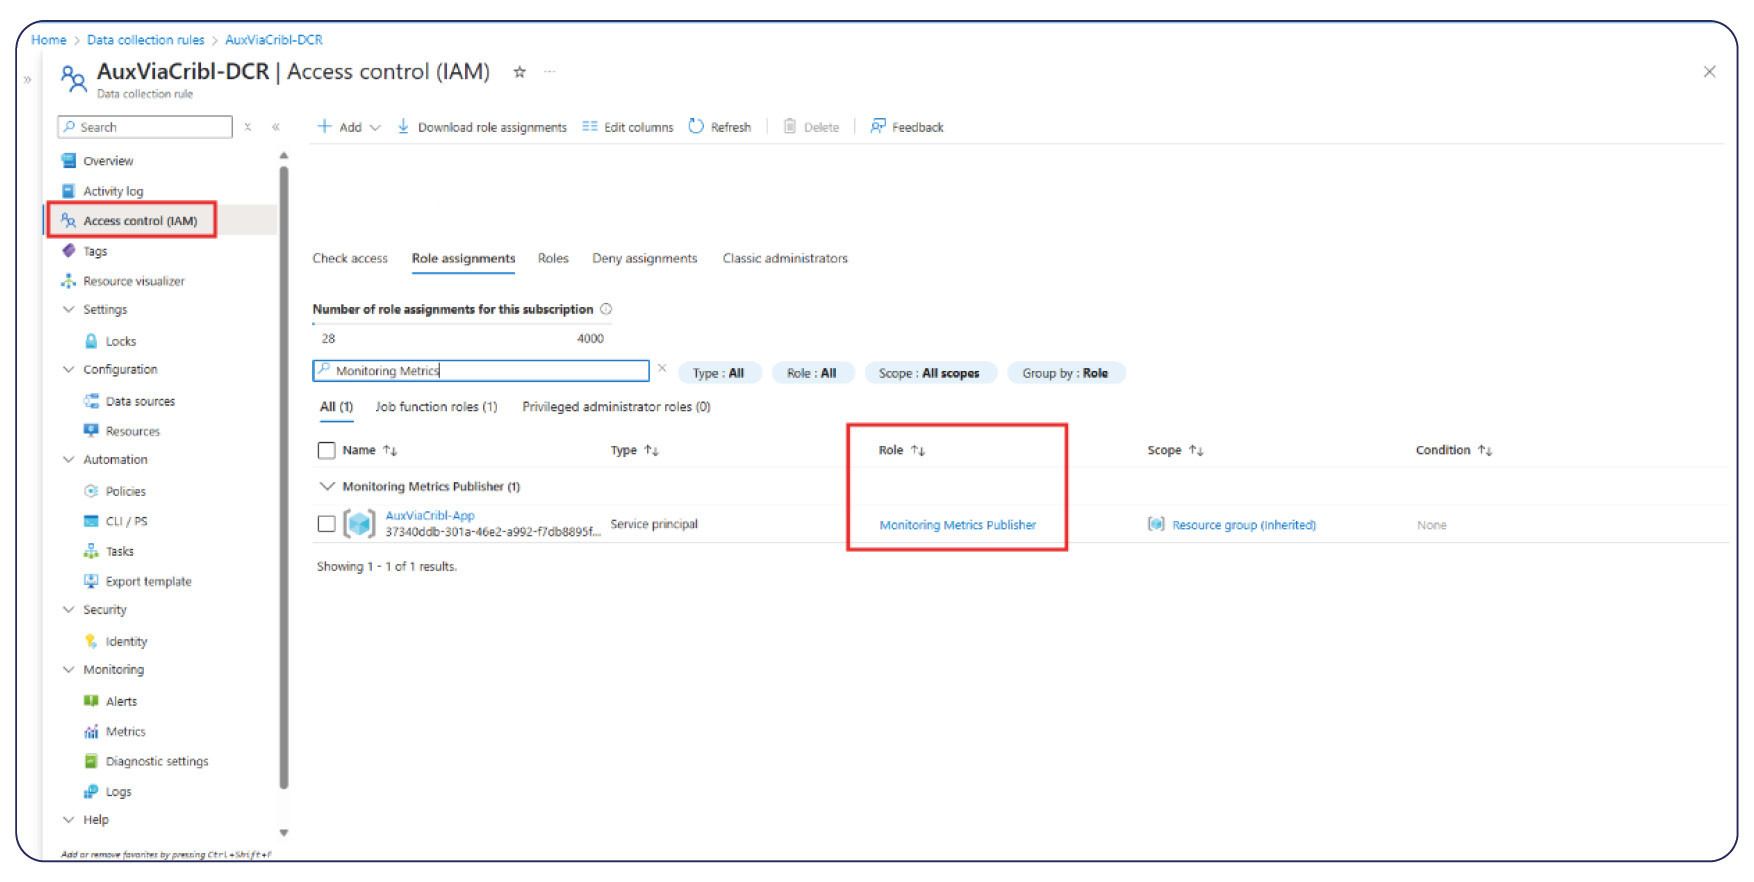
Authorise App DCR
Next we must Authorize the App to use Data Collection Rules; Navigate to the Microsoft Azure Portal and go to:
• Data Collection Rules > IAM > add a role assignment > select Monitoring Metrics Publisher role to
| Complete! You can now analyse the data landing in your auxiliary logs for advanced Threat Hunting or any other projects you may we working on. |
Key Takeaways
Auxiliary logs may not yet be in General Availability, but have shown great promise already, primarily for storage costs. We are no longer penalised for gathering more data than is considered core information – but must now weigh up the cheaper costs of storage against the cost of processing these larger logs and the true strategic security value from our now vastly expanded datasets.
Start by having a look at all the peripheral logs and menial logs that can be included now and see how they could help you identify weak point or attack behaviours, or also to enrich the contextual information for an identified attack using Basic & Analytics logs.